Week 5: Review Heating System Data & Graphs
Posted on September 29th, 2025
Use performance data and heating graphs to identify inefficiencies or early signs of problems.
Your Inspire thermostat account and smart meters gives landlords a powerful insight into how heating systems are performing. A quick weekly review can spot small problems before they turn into cold tenants or big bills.
1) What Data Should a Landlord Look At?
From the Inspire Account:
- Room temperature vs set point (target) over time
- Heating runtime (minutes/hours per day)
From a Smart Meter (highly recommended):
- Half-hourly gas kWh (or daily totals) – shows actual energy used by heating and hot water
- Half-hourly electricity usage – useful to detect electric heaters
Traditional Sources:
- Monthly gas/electric bills (less useful – by the time you notice an increase, it’s often too late)
- Tenant reports (cold rooms, unusual noise, frequent resets)
2) Set Up a Fair Test (So the Data Makes Sense)
- Pick a 7-day window (ideally a typical cool week).
- Fix a consistent heating schedule (e.g., 06:30–08:30 and 17:00–22:00, at 21 °C).
- Briefly note the outdoor weather (cold, rainy, mild) to explain usage differences.
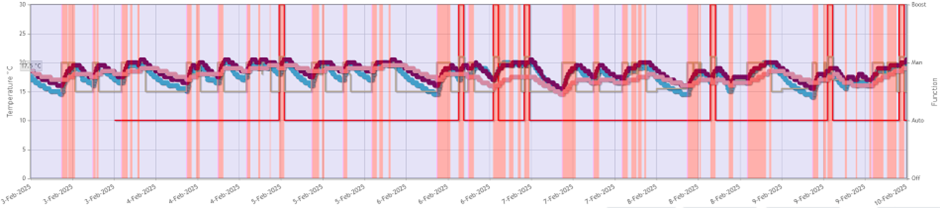
3) Smart-Meter Usage
- Access half-hourly usage data from your energy provider.
- Compare heating hours with gas kWh spikes.
- Good: higher gas usage lines up with heating periods.
- Warning: constant draw when heating is off, or heating times with no corresponding gas increase (possible fault).
- Look for unexplained temperature spikes when heating is off.
- Could indicate electric heaters. Check electricity smart-meter data – electric heaters typically add ~2 kWh above base load.
4) How to Review the Graphs (Step by Step)
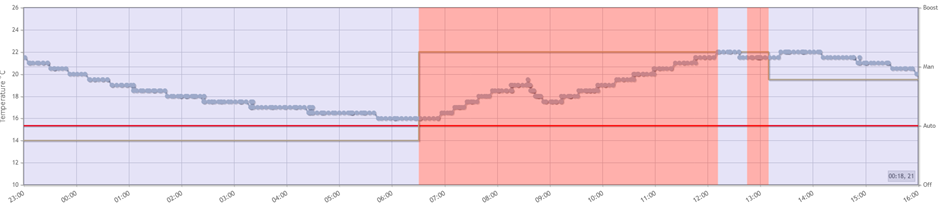
A. Temperature vs Target
Open the Inspire graph and check how the room temperature rises to the target during heating periods.
Slow to increase
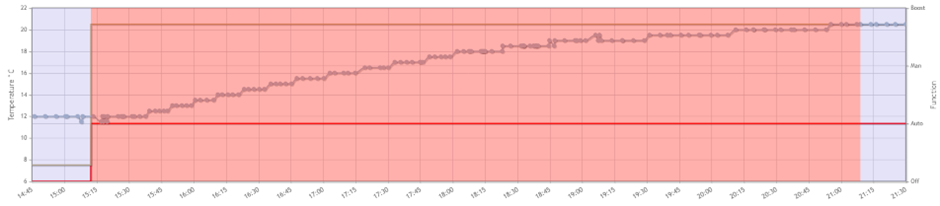
- Example: taking 6 hours to reach target on a cold day.
- Actions:
- Improve insulation.
- Check radiator is heating properly (may need bleeding, balancing, or boiler flow temp adjustment).
- Ensure windows/doors are closed.
- If persistent, consider a larger or second radiator.
- Note: Don’t let occupied properties drop too low to begin with.
Temperature increases with heating off
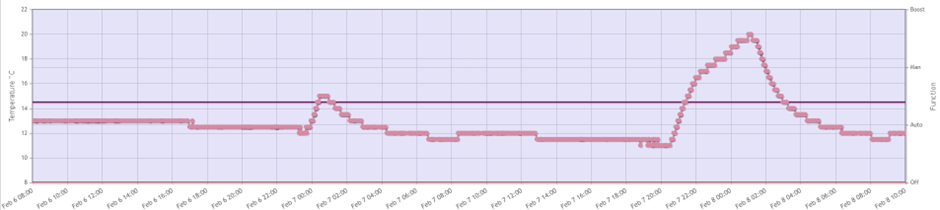
- Graph shows spikes when thermostat is off/no call for heat.
- Actions:
- Daytime spikes → Could be direct sunlight hitting thermostat, check against weather. (relocate if needed).
- Evening/night spikes → external heat source, likely electric heaters (check electricity smart-meter data for ~2 kWh bumps).
Not reaching target
- Temperature rises slightly then flatlines.
- Causes & fixes:
- TRV in same room as thermostat closing prematurely – ideally remove.
- Check heating is running and all radiators are hot.
- Look for 3rd-party timers preventing boiler from firing.
- Check boiler flow temperature and modes (e.g., combi set to hot water only).
Temperature dropping while heating is on
- Graph shows temperature falling despite call for heat.
- Causes & fixes:
- Door or window left open (check smart meter – if gas usage is normal, it’s probably ventilation).
- Consistent daily/weekly patterns → 3rd-party timer cutting heating.
- Random unexplained drops → potential heating fault.
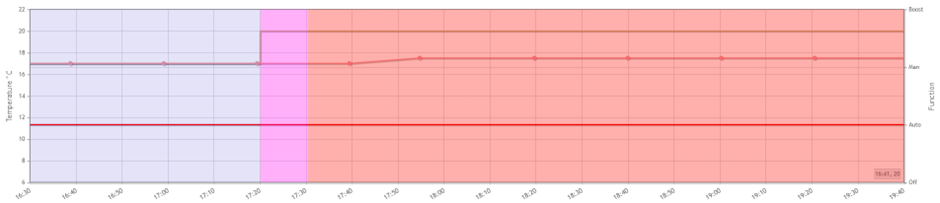
B. Boosting
Check how often tenants are using the “boost” function (red line on the Inspire graph).
- Example: 7 boosts in a week = perfectly reasonable.
- Excessive boosts:
- Ask tenants why (they may simply prefer more control).
- Review and adjust the set schedule to reduce the need for manual boosting.
Quick Wins This Week
✅ Review your Inspire heating graphs and check for issues.
✅ Compare with smart-meter data for irregularities (especially electric heater use).
✅ Make simple adjustments if required.